
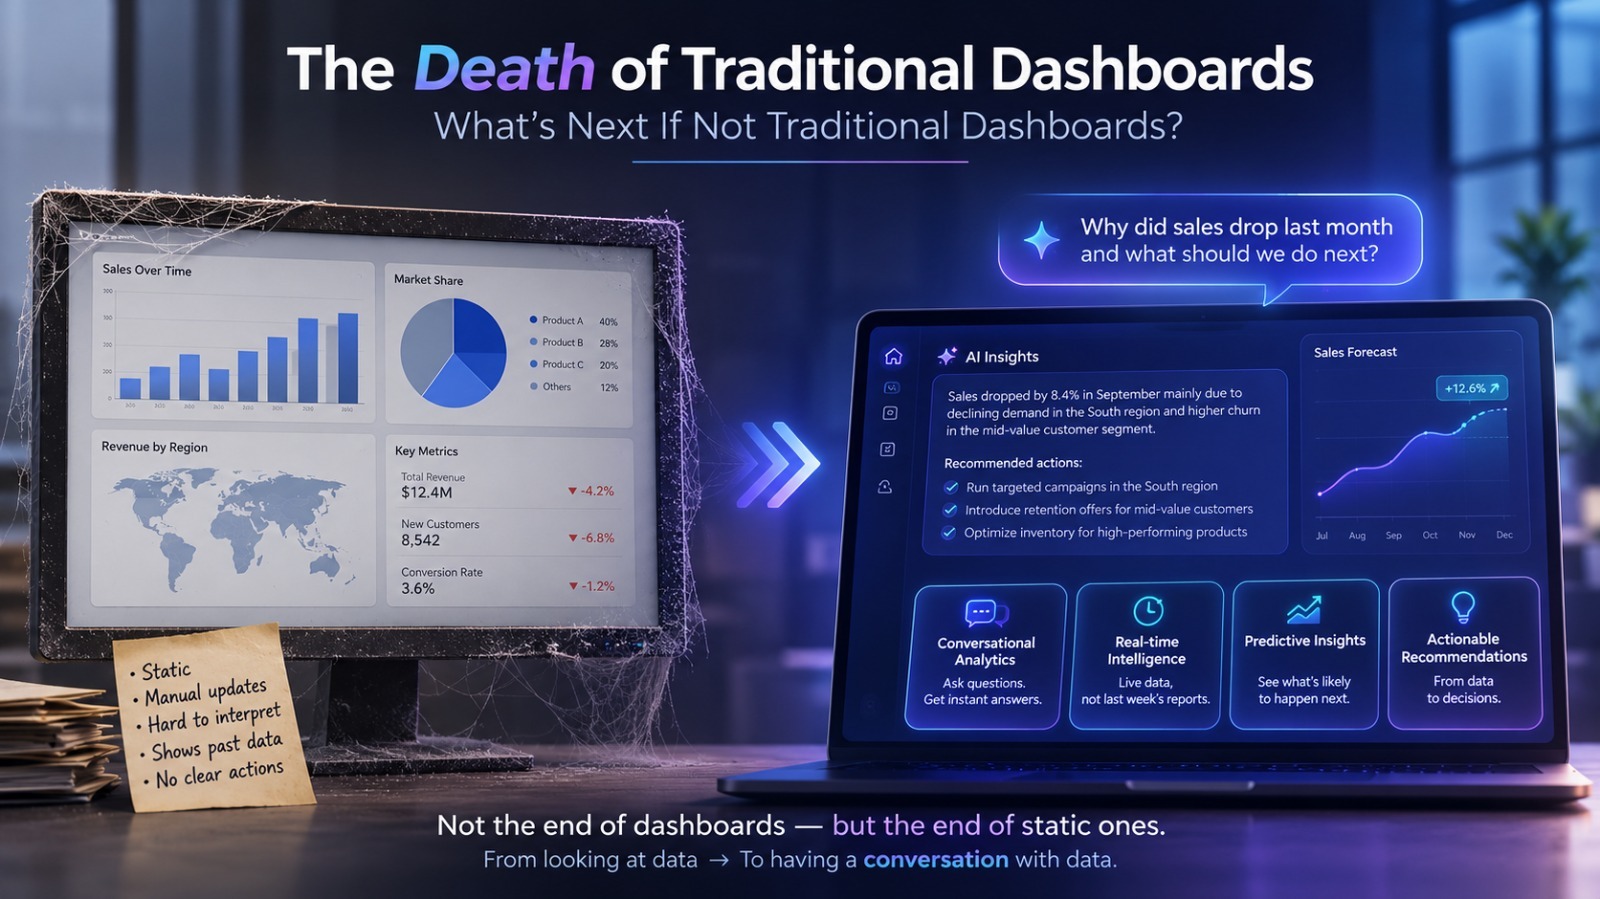
The Death of Traditional Dashboards: Why Static Reporting Is Losing to AI-Driven Insights
Introduction
Walk into almost any company today and you'll find the same graveyard: a Tableau dashboard nobody has opened in three months, a Power BI report built for a meeting that happened once, a Looker view with forty widgets and zero insight. Traditional dashboards — the static, chart-heavy, click-to-filter interfaces that defined business intelligence for two decades — are dying. Not because data stopped mattering, but because the way we need to consume it has fundamentally changed.
Dashboard Fatigue Is Real
The average enterprise now runs dozens — sometimes hundreds — of dashboards across departments. Most go stale within weeks. Teams build dashboards reactively for a single question, then abandon them, creating sprawling dashboard graveyards that cost more to maintain than they deliver in value.
Dashboards Are Passive, Not Proactive
A dashboard only works if someone remembers to open it, knows what to look for, and correctly interprets what they see. It doesn't tell you something's wrong — it waits for you to notice. In fast-moving businesses, that lag is expensive.
One-Size-Fits-All Views Don't Match How People Think
Dashboards are built once, for an average user, then used by executives, analysts, and frontline managers alike — none of whom have the same question. The result is either oversimplified charts or overwhelming complexity, satisfying no one.
The Filter-and-Click Bottleneck
Even well-designed dashboards require users to know which filters to apply and which metric combinations matter. This assumes a level of data literacy most business users simply don't have time to develop.
Conversational and Natural Language Analytics
Instead of hunting through filters, users now ask questions in plain language, such as why churn spiked in a given quarter, and get direct answers with the relevant chart generated on the fly. Organizations building with AI Software Development & Integration are embedding natural language query layers directly on top of existing data warehouses.
Embedded and Contextual Insights
Analytics is moving out of standalone BI tools and into the workflows where decisions actually happen — inside CRMs, product interfaces, Slack channels, and internal tools built through modern Web Development Services. Instead of visiting a dashboard, the insight visits you, at the exact moment it's relevant.
Proactive Alerting and Anomaly Detection
AI-native analytics systems flag anomalies and trends automatically, pushing alerts before a human would ever think to check. This flips BI from a pull model, where you check the dashboard, to a push model, where the system tells you.
Decision Intelligence Over Data Visualization
The next generation of analytics tools doesn't just show what happened, it recommends what to do next. Decision intelligence platforms combine historical data, predictive models, and business rules to suggest concrete actions, not just charts.
Narrative and AI-Generated Data Storytelling
Rather than a wall of charts, modern tools generate a written summary of what changed, why it likely changed, and what to watch next, auto-written in the language executives actually read reports in.
The Technology Driving This Shift
Three forces are converging to make this possible: large language models capable of interpreting and explaining data in natural language, real-time data pipelines that eliminate the lag between an event and its visibility, and AI agents that can autonomously monitor metrics and take or recommend action. Businesses migrating to modern Cloud Services & Infrastructure are best positioned to adopt these capabilities quickly.
Is This the End of Dashboards Entirely?
Not quite. Dashboards won't disappear completely, since some use cases like real-time operations monitoring and standardized executive reporting still benefit from a persistent visual surface. But the default interface for exploring data is shifting away from static grids of charts and toward adaptive, conversational, and proactive systems.
What Businesses Should Do Now
1. Audit existing dashboards and retire ones nobody actively uses.
2. Invest in natural language and conversational query layers on top of existing data warehouses.
3. Shift from 'build a dashboard' requests to 'define the decision this needs to inform.'
4. Pilot embedded analytics inside the tools your teams already use daily.
5. Set up proactive alerting for your most business-critical metrics before building any new visual dashboard.
Conclusion
Traditional dashboards were built for a world where data was scarce and analysts were the gatekeepers. That world is gone. The businesses winning with data today aren't the ones with the prettiest charts, they're the ones that get the right insight to the right person at the right moment, without anyone having to go looking for it. The dashboard isn't dead because data stopped mattering. It's dead because we finally have something better.